DATABASE FOR TURBULENT PILOTED FLAMES WITH COMPOSITIONALLY INHOMOGENEOUS INLETS
Turbulent flames
with inhomogeneous inlets are highly relevant for a range of practical
applications such as gas turbines and engines where, either by design or due
to instability, concentration gradients form upstream of the exit plane of
the combustor so that the issuing mixture is compositionally inhomogeneous.
Combustion in such environments may cover a range of modes such as premixed,
stratified and non-premixed since mixture fractions may span the entire
domain. There is need, therefore, for reliable generalized combustion models
capable of accounting for the mixed-modes that are present in real combustors.
The modified piloted burner presented here is capable of stabilizing
flames where multi-mode combustion occurs and hence the data base is
relevant for the development and validation of such generalised models.
Distinction is made here between partially premixed flames with compositionally
inhomogeneous inlet conditions and flows where the fluid is also partially
premixed but with either homogeneous or near-homogeneous inlets.
This database presents measurements of flow, mixing and composition fields in a
range of flames that have different inlet conditions and departures from blow-off.
The objective is to facilitate the development of universal combustion models
capable of accounting for all modes of combustion that may be present within
a combustor. Some measurements of flow and mixing fields are presented for
selected non-reacting cases to assist in validating this aspect of their codes.
Detailed boundary conditions are tabulated as relevant. The pilot stream usually
consists of three gases (acetylene, hydrogen and air, referred to as 3GP) and has
an adiabatic flame temperature that is higher than that of the parent fuel. To remedy this, a
five-gas mixture (acetylene, hydrogen, carbon dioxide, nitrogen and air, referred to as 5GP) is also used
in the pilot for some selected conditions.
This site provides detailed description of the following sections:
- Experimental set-up: showing details of the burner.
- Stability characteristics: plotted for CNG fuel using the three-gas pilot and for methane fuel using both the 3GP and the 5GP.
- Photographs: showing the visible appearance of selected flames.
- Non-reacting jets: showing boundary conditions as well as flow fields for a range of selected cases (see Table 2).
- Reacting jets: There are a few sub-sections here. One presents
details of the flow fields and boundary conditions for selected flames using CNG
as fuel with a three-gas pilot (see Table 3). Another section presents composition
measurements for THREE sets of data, all with pure methane as fuel:
- I2013-3GP: Measurements in flames with the three gas pilot, performed in 2013 at normal resolution.
- I2013-5GP: Measurements in flames with the five gas pilot, performed in 2013 at normal resolution.
- I2015-5GP: Measurements in flames with the five gas pilot, performed in 2015 at high resolution and with
the addition of cross-planar OH LIF to enhance the measurements of scalar dissipation to 3D.
Note: This is the recommended data set for the purpose of validating combustion models.
Note that measurements of flow fields, Rayleigh imaging of mixing fields at the jet exit plane (to obtain mixture fraction), and high-speed LIF-OH images are all performed at Sydney University using CNG as fuel. The line-Raman-Rayleigh measurements (I2013-3GP, I2013-5GP and I2015-5GP) are performed at Sandia's Combustion Research Facility using methane as fuel. Further details on this and the selected cases are given below.
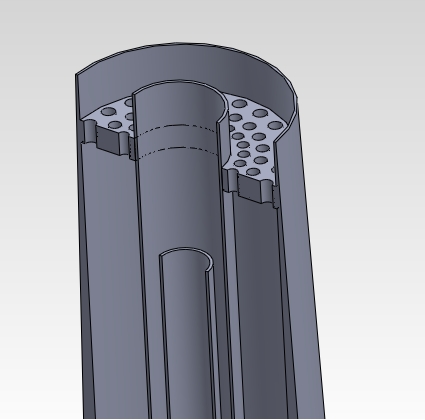
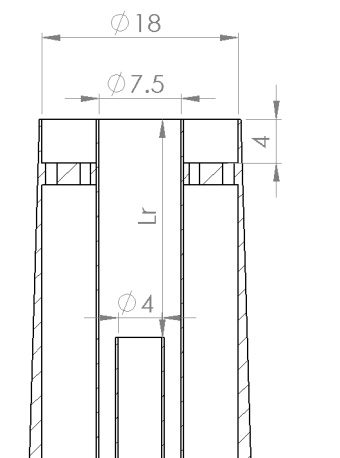
The burner [1], shown in
Figure 1, consists of two concentric tubes referred to hereon as the "inner" or "central"
pipe with an inside diameter of d=4 mm (wall thickness of 0.25 mm) and an "outer pipe"
or "annulus" with an inside diameter of D=7.5 mm (wall thickness of 0.25 mm). The outer
tube is shrouded by the pilot stream which has an inside diameter of Dp=18 mm and a wall
thickness of 0.2 mm. The burner assembly which is duplicated at Sydney and Sandia is
centered in a wind tunnel supplying a co-flowing air stream at a fixed velocity,
Uc=15 m/s. At Sydney, the wind tunnel has a square cross section of 15x15 cm while
at Sandia the tunnel is larger at 30x30 cm. Fuel can be injected in the inner tube
while air flows in the outer tube in which case the configuration is referred to as FJ.
The inverse case where fuel issues from the annulus is referred to as FA. When both inner
and outer tubes are flush with the exit plane, the flame is fully non-premixed while
near-homogeneous mixing occurs when the inner tube is recessed by 300 mm (75 inner tube
diameters).
|
|
|
Fig. 1: Schematic of the piloted burner with a recess in the inner pipe |
The fuel used is either methane
(CP grade, 99.0% CH4) or compressed natural gas (CNG which consists of 88% CH4, 7.8% C2H4,
1.9% CO2, and 1.2% N2 by volume with the remaining balance of 1.1% consisting of H2, H2O
and other hydrocarbons). CNG is used for the experiments conducted at Sydney while methane
is employed at Sandia for the Raman-Rayleigh line measurements. Two pilot gas mixtures
are also used: a 3-gas mixture consisting C2H2, H2, and air and a 5-gas mixture of C2H2, H2,
CO2, N2, and air with both mixtures having a C/H ratio of 1/4 matching that of methane. The
3-gas mixture produces excess heat with an adiabatic temperature of 2480 K while the 5-gas
mixture is chosen to match the adiabatic equilibrium temperature of methane which is 2226 K.
Conditions using the 3-gas pilot are referred to here on as 3GP while those using the 5-gas pilot
as 5GP. Both pilot conditions are operated at stoichiometric and a heat release rate of 2.22kW.
This corresponds to a bulk unburned pilot velocity of U
As documented in [1],
parameters that affect flame stability are: (i) the bulk jet velocity, UJ
(ii) the ratio of bulk air to fuel injected through the outer and inner tubes,
or bulk equivalence ratio at the jet exit plane, φJ
(the volumetric ratio is referred to as VA/VF while the
mass ratio is MA/MF), (iii) the distance of recession of
the inner tube, Lr; (iv) the heat release from the pilot, Hp;
and (v) the velocity of the co-flowing air, Uc. Details presented in this section will
highlight which of these are primary, controlling parameters. Turbulence levels
in the co-flow, as well as the boundary layer thickness on the outer surface of
the burner may also affect the flame and these will be specified in the
boundary conditions. The bulk velocity, UJ is determined from the
total flow of fuel and air in the outer and inner tubes divided by the exit
area of the outer tube (which is larger than the sum of the areas of the inner tube
and the annulus due to the wall thickness). The RMS
fluctuations of velocity and mixture fraction at the jet exit plane are
dictated by the extent of recession, Lr as
well as the fuel and air flow through the inner and outer pipes.
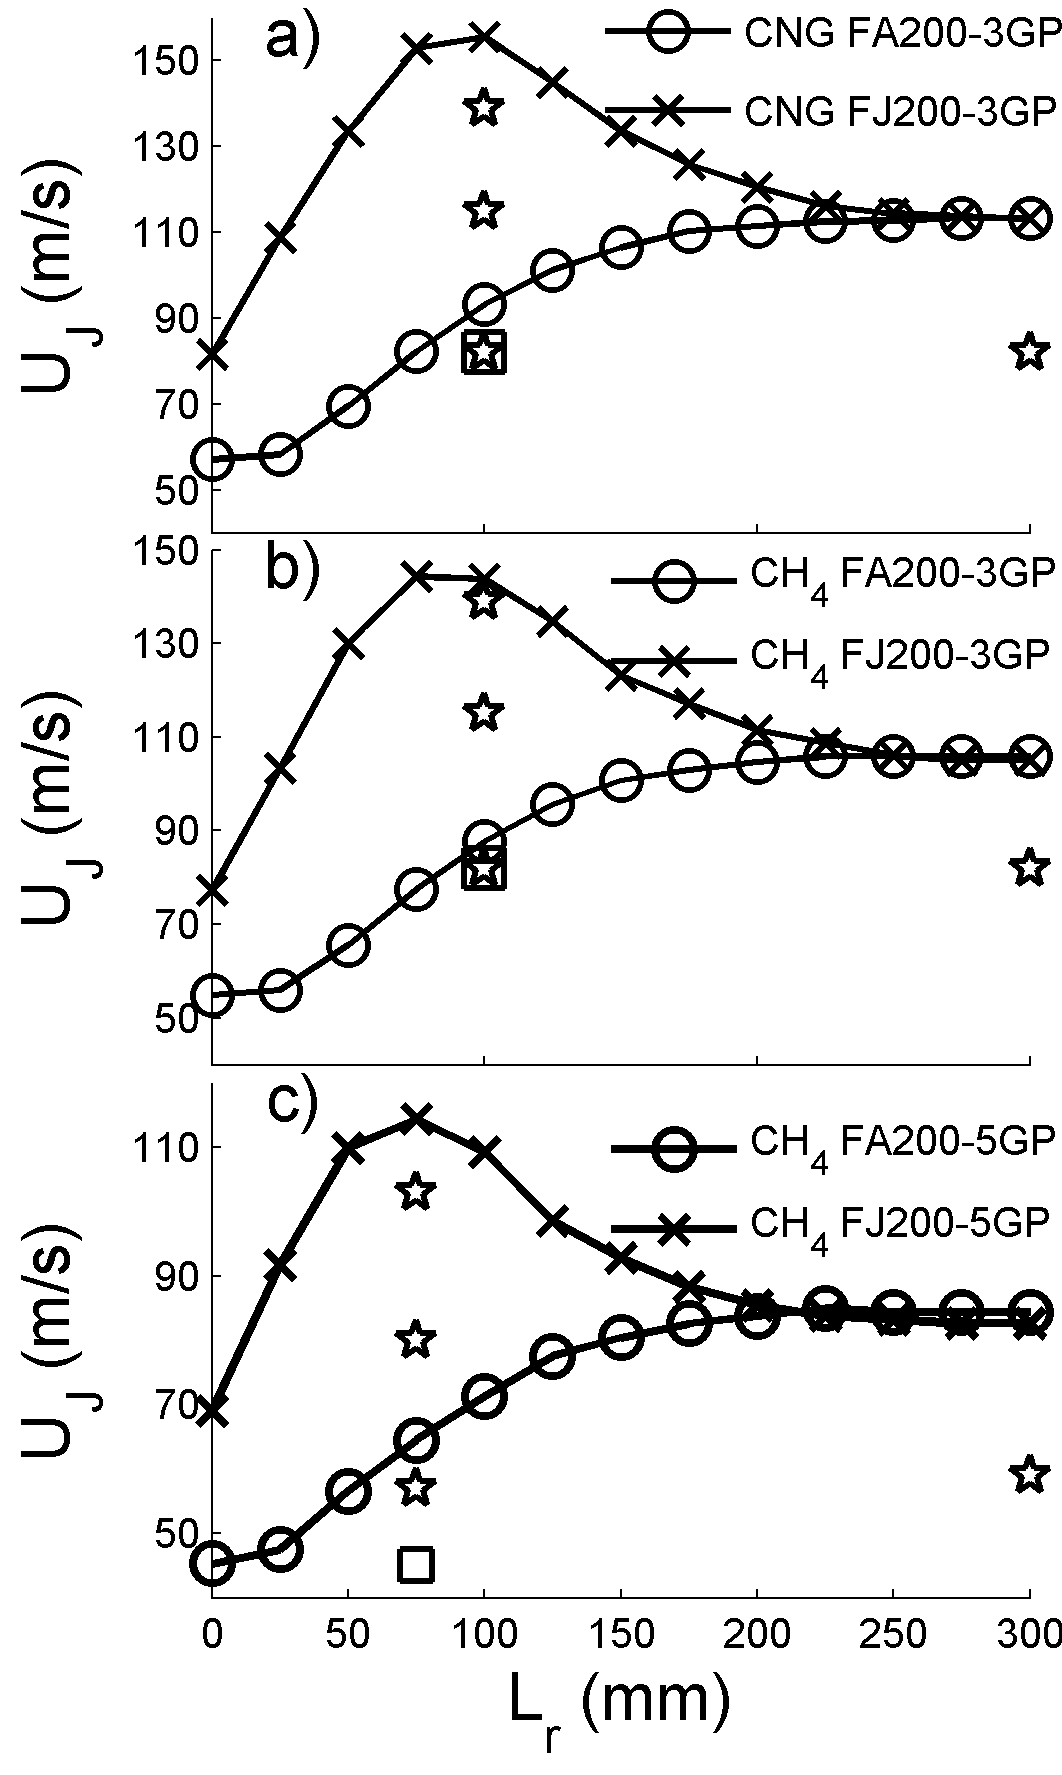
Figure 2 shows the blow off limits plotted as bulk jet velocity UJ at blow-off, Ubo,
versus recess distance, Lr.
Results are shown for both the FA and FJ configurations with a volumetric ratio
between the air and fuel streams, VA/VF=2.00 so that
for CNG: φJ=4.79, UA/UF=0.89,
MA/MF =3.26, and ξJ=0.235while
for methane fuel: φJ=4.76, UA/UF=0.89,
MA/MF =3.6, and ξJ=0.217.
Subscripts “A” and “F” refer, respectively, to
the air and fuel streams upstream of the jet exit plane so that UA=bulk
velocity in the air stream and UF=bulk fuel velocity in the fuel
stream (Note that, due to the wall thickness (0.25mm) of the inner tube, the
area at the jet exit plane (corresponding UJ) is larger than the
sum of the areas of the inner tube and the annulus(corresponding to UA
and UF)
Figure 2a shows the blow-off limits for CNG using the 3-gas pilot while those for
methane (also using the 3-gas pilot) are shown in Fig. 2b. Figure 2c shows the
blow-off limits also obtained for methane but with the 5-gas pilot. In all cases,
the FJ configuration shows the
blow-off velocity peaking at some intermediate recess distance, Lr between 75mm and 100mm, while the FA cases
experience a progressive increase in Ubo
with recess distance. At Lr~300 mm both configurations converge to
the same blow-off velocity, which corresponds to the homogeneous limit. The
difference in blow off limits between CH4 and CNG (Figures 2a and
2b) is attributed to the ethylene content. This was confirmed by Meares [2,3], where, using the same burner, incremental addition of
ethylene to pure methane fuel led to a gradual enhancement of the blow off
velocity. In Figs. 2b and 2c, the difference in the blow-off limits between the
3GP and 5GP cases is expected due to the lower temperature content in the latter.
|
|
|
Fig. 2: Bulk jet velocity at the blow-off limit, Uj=Ubo plotted versus recess distance of the inner tube, Lr. Crosses refer to the blow-off limits for the FJ configuration while circles refer to the blow-off limits for the FA configuration. Top plot shows the limits for CNG fuel with a 3-gas pilot (3GP). Middle plot shows the limits for CH4 fuel with a 3-gas pilot (3GP). Bottom plot shows the limits for CH4 fuel with a 5-gas pilot (5GP). Stars and squares (FJ and FA configurations respectively) represent the conditions of specific flames for study. |
Five flames were selected
for further measurements for each of the 3GP and 5GP cases as shown by the stars
(FJ configuration) and squares (FA configuration) on Figs. 2a-2c. Further details about
the selected cases are listed in Table 1. The bulk velocity Uj is based on
the total volumetric gas flow rate through the exit plane of the burner. The Reynolds
number is based on UJ at the jet exit plane and the annulus diameter, while
UA and UF refer to the bulk velocities in the air and fuel streams
upstream of the jet exit plane. The potential heat release, Hr is calculated
from the lower heating value and the bulk mass flow rate of methane. For the 3GP cases,
three of the five selected flames (FJ200-3GP-Lr100-82, FJ200-3GP-Lr300-82, and
FA200-3GP-Lr100-82) have a fixed UJ=82m/s but different levels of inhomogeneity
at the inlet as well as different departures from blow-off. However, for the 5GP cases,
three flames are selected to have the same departure from blow-off but different levels
of inhomogeneity at the inlet as well as different values of UJ (FJ200-5GP-Lr75-80,
FJ200-5GP-Lr300-59, and FA200-5GP-Lr75-45). Flames FJ200-3GP-Lr100-82, FJ200-3GP-Lr100-115,
and FJ200-3GP-Lr100-139 have the same inlet configuration but increasing jet velocity
and hence different departures from blow-off. This is also true for cases FJ200-5GP-Lr75-59,
FJ200-5GP-Lr75-80, and FJ200-5GP-Lr75-103. Note that the recession distance is, at times,
conveniently removed from the names so that, for example, FJ200-3GP-Lr300-82 and
FJ200-3GP-300-82 refer to the same case.
| 3-Gas Pilot Cases with CNG | Lr (mm) | UJ (m/s) | Ubo (m/s) | UJ/Ubo (%) | UA (m/s) | UF (m/s) | ReJ | Hr (kW) |
|---|---|---|---|---|---|---|---|---|
| FA200-3GP-Lr100-82 | 100 | 82 | 93.2 | 88 | 192.2 | 42.7 | 39200 | 40.3 |
| FJ200-3GP-Lr300-82 | 300 | 82 | 113.1 | 73 | 85.4 | 96.1 | 39200 | 40.3 |
| FJ200-3GP-Lr100-82 | 100 | 82 | 155.6 | 53 | 85.4 | 96.1 | 39200 | 40.3 |
| FJ200-3GP-Lr100-115 | 100 | 115 | 155.6 | 74 | 119.8 | 134.8 | 55000 | 56.5 |
| FJ200-3GP-Lr100-139 | 100 | 139 | 155.6 | 89 | 144.8 | 162.9 | 66500 | 68.2 |
| 3-Gas Pilot Cases with CH4 | Lr (mm) | UJ (m/s) | Ubo (m/s) | UJ/Ubo (%) | UA (m/s) | UF (m/s) | ReJ | Hr (kW) |
| FA200-3GP-Lr100-82 | 100 | 82 | 87.7 | 94 | 191.7 | 42.6 | 38300 | 39.4 |
| FJ200-3GP-Lr300-82 | 300 | 82 | 105.0 | 78 | 85.3 | 96.0 | 38300 | 39.4 |
| FJ200-3GP-Lr100-82 | 100 | 82 | 143.7 | 57 | 84.9 | 95.5 | 38300 | 39.4 |
| FJ200-3GP-Lr100-115 | 100 | 115 | 143.7 | 80 | 119.2 | 134.1 | 53600 | 55.2 |
| FJ200-3GP-Lr100-139 | 100 | 139 | 143.7 | 97 | 144.5 | 162.6 | 65000 | 66.9 |
| 5-Gas Pilot Cases with CH4 | Lr (mm) | UJ (m/s) | Ubo (m/s) | UJ/Ubo (%) | UA (m/s) | UF (m/s) | ReJ | Hr (kW) |
| FA200-5GP-Lr75-45 | 75 | 45 | 64.5 | 70 | 105.8 | 23.5 | 21200 | 21.8 |
| FJ200-5GP-Lr300-59 | 300 | 59 | 84.3 | 70 | 61.5 | 69.2 | 27600 | 28.5 |
| FJ200-5GP-Lr75-57 | 75 | 57 | 114.3 | 50 | 59.5 | 67 | 26800 | 27.6 |
| FJ200-5GP-Lr75-80 | 75 | 80 | 114.3 | 70 | 83.4 | 93.8 | 37500 | 38.6 |
| FJ200-5GP-Lr75-103 | 75 | 103 | 114.3 | 90 | 107.2 | 120.6 | 48300 | 49.6 |
The 3GP cases were
used at Sydney with CNG fuel to perform measurements of flow fields as well as
high-speed LIF imaging of OH (HS-LIF-OH). Using methane as fuel, both 3GP and
5GP cases were used in 2013 at Sandia for detailed measurements of composition but with regular resolution.
The data sets resulting from these campaigns are referred to hereon as I2013-3GP and I2013-5GP, respectively.
Additionally, multi-scalar diagnostics of the 5GP cases was undertaken in 2015 with improved resolution
and with cross-plane imaging of OH-LIF to enable and estimate of the three dimensional scalar dissipation.
This data set is referred to here on as I2015-5GP.
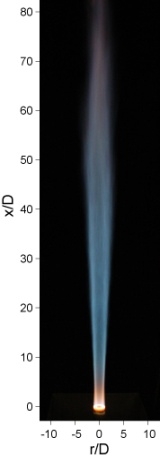
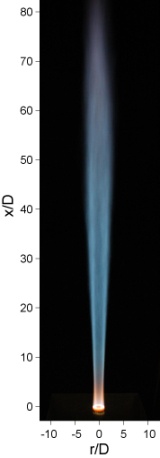
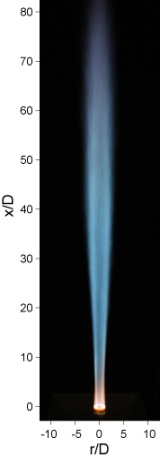
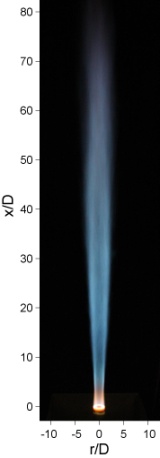
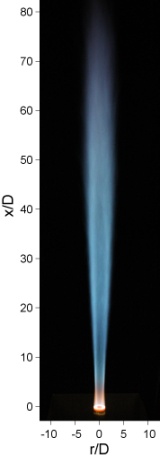
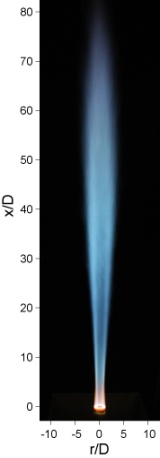
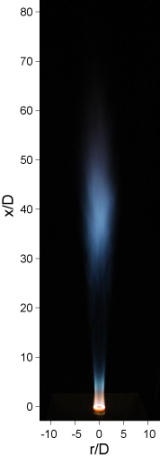
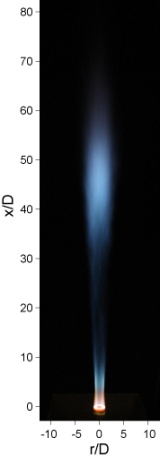
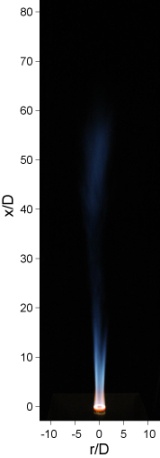
Photographs of the flame series
for different departures from blow off are shown below. Approximate values are noted for
UJ/Ubo since the appearance of the flame is similar within these bands.
The following explanation is given for the naming terminology:
FA200-3GP-Lr100-82: refers to a flame in the FA configuration (fuel in the annulus), VA/VF=2.00,
recess, Lr=100mm, bulk velocity of UJ=82m/s, and with a 3-gas pilot.
FJ200-3GP-300-139: refers to FJ configuration (fuel in the central pipe), with
VA/VF=2.00, recess Lr=300mm, UJ=139m/s, and with a 3-gas pilot.
| FA200-100 | FJ200-300 | FJ200-100 | |
| UJ/Ubo ~ 50-55% |
|
|
|
| UJ/Ubo ~ 70-75% |
|
|
|
| UJ/Ubo ~ 90-95% |
|
|
|
This section provides measurements of velocity
fields performed at the University of Sydney in selected jets of CNG. Standard laser Doppler velocimetry
(LDV) is used for the measurements of velocity by seeding the inner and outer jets with sub-micron aluminium
oxide particles. In a separate experiment, the Rayleigh scattering technique is used to provide a quantitative
and instantaneous measure of mixture fraction at the jet exit plane. This is possible given the significant
differences in the Rayleigh cross sections of methane and air. The boundary conditions are also provided for
the co-flowing stream including the boundary layer on the outer surface of the burner. Cases for which
measurements are provided are listed in Table 2.
Practical limitations of the measurement techniques dictate that the boundary conditions for velocity were
measured at x/D = 0.2, and the boundary conditions for mixture fraction were measured at x/D = 0.5.
It is expected that these are sufficiently representative of conditions at the jet exit plane.
| Flame Code/Configuration | Lr (mm) | UJ (m/s) | UA (m/s) | UF (m/s) | ReJ | UJ/Ubo | Velocity Locations (x/D) | Mixture Fraction Locations (x/D) | FA200-3GP-Lr100-82 | 100 | 82 | 192.2 | 42.7 | 39200 | 88 | 0.2, 1, 5, 10, 20 | 0.5 |
|---|---|---|---|---|---|---|---|---|
| FJ200-3GP-Lr100-82 | 100 | 82 | 85.4 | 96.1 | 39200 | 53 | 0.2, 1, 5, 10 | 0.5 |
| FJ200-3GP-Lr100-139 | 100 | 139 | 144.8 | 162.9 | 66500 | 89 | 0.2, 1, 5, 10, 20 | 0.5 |
Boundary Conditions:
Non-reacting_Velocity_Boundary_Condition.zip
Coflow.csv (zeros denote no available data)
Non-reacting_mixture_Fraction_Boundary_Condition.zip
Velocity Profiles:
Non-reacting_Velocity.zip
There are a few sub-sections here due to the fact that the velocity and
Rayleigh imaging of mixture fraction, as well as the high-speed LIF-OH imaging were
performed at The University of Sydney using CNG as fuel with a three-gas pilot.
Additionally, line-Raman-Rayleigh measurements were performed at Sandia using methane
as fuel with both three-gas and five-gas pilot. Ten cases are considered for further
measurements and these are listed in Tables 3-5. Tables 3 and 4 lists cases with the
same jet velocities but note that these have different departures from blow-off due to
the different blow-off limits of CNG and methane (see Fig. 2). Table 3 lists the cases
with 3GP studied at Sydney while Table 4 lists the cases measured at Sandia in 2013
using the 3GP (Data Set: I2013-3GP). Table 5 lists cases using the 5GP. These have
different blow-off limits and different jet velocities. The cases listed in Table 5
have been used both in 2013 (with normal resolution, Data Set: I2013-5GP) and 2015
(with high resolution, Data Set: I2015-5GP).
The first sub-section presents details of the flow fields and boundary conditions
(CNG fuel), this is followed by the Sandia composition measurements from three separate
datasets for 3GP and 5GP flames but with pure methane. The final sub-section presents
samples of high-speed LIF-OH sequences collected at a repetition rate of 10 kHz are
also shown for CNG-3GP flames (see Table 6).
Velocity Profiles and Boundary Conditions:
Table 3 shows the conditions for which measurements are presented here.Three of the five selected flames
(FA200-3GP-Lr100-82, FJ200-3GP-Lr100-82 and FJ200-3GP-Lr300-82) have a fixed UJ=82 m/s but
different levels of inhomogeneity at the inlet as well as different departures from blow-off. Flames
FJ200-3GP-Lr100-82, FJ200-3GP-Lr100-115, and FJ200-3GP-Lr100-139 have the same inlet configuration
but increasing jet velocity and hence different departures from blow-off.
| Flame Code/Configuration | Lr (mm) | UJ (m/s) | UA (m/s) | UF (m/s) | ReJ | UJ/Ubo | Velocity Locations (x/D) | Mixture Fraction Locations (x/D) | FA200-3GP-Lr100-82 | 100 | 82 | 192.2 | 42.7 | 39200 | 88 | 0.2, 1, 5, 10, 20, 30 ,50 | 0.5 |
|---|---|---|---|---|---|---|---|---|
| FJ200-3GP-Lr300-82 | 300 | 82 | 85.4 | 96.1 | 39200 | 73 | 0.2, 1, 5, 10, 20, 30, 50 | 0.5 |
| FJ200-3GP-Lr100-82 | 100 | 82 | 85.4 | 96.1 | 39200 | 53 | 0.2, 1, 5, 10, 20, 30, 50 | 0.5 |
| FJ200-3GP-Lr100-115 | 100 | 115 | 119.8 | 134.8 | 55000 | 74 | 0.2, 1, 5, 10, 20, 30, 50 | 0.5 |
| FJ200-3GP-Lr100-139 | 100 | 139 | 144.8 | 162.9 | 66500 | 89 | 0.2, 1, 5, 10, 20, 30, 50 | 0.5 |
The following conditions are fixed for all cases shown here:
- Stoichiometric pilot with an unburnt bulk velocity, Upu=3.0m/s which corresponds to a heat release rate of Hp=2.22 kW. Note that the pilot is a mixture of acetylene, hydrogen and air with a C/H of 1/4 matching that of methane but with a higher adiabatic flame temperature 2480 K.
- The velocity ratio VA/VF=2.0 so that for CNG: φJ=4.79, UA/UF=0.89, MA/MF =3.26, and ξJ=0.235 while for methane fuel: φJ=4.76, UA/UF=0.89, MA/MF =3.6, and ξJ=0.217.
- The coflow air velocity is fixed at: UC=15m/s.
Note that for the reacting cases, the boundary conditions for mixture fraction are obtained here from Rayleigh
measurements in non-reacting jets of similar inlet conditions. This is acceptable considering the conditions are
identical at the jet exit plane. This has been confirmed by comparing, at the jet exit plane, the Rayleigh
measurements of mixture fraction in non-reacting jet with the detailed measurements obtained at Sandia in the
reacting counterparts.
Boundary Conditions:
Reacting_Velocity_Boundary_Condition-3GP.zip
Coflow.csv (zeros denote no available data)
Reacting_Mixture_Fraction_Boundary_Condition-3GP.zip
Reacting_Mixture_Fraction_Boundary_Condition-5GP.zip
Boundary Conditions-Pilot-CH4-3G&5G.xlsx
Notes:
- The mixture fractions provided for the 3GP cases as boundary conditions are obtained from Rayleigh measurements performed at Sydney in non-reacting jets with similar inlets conditions to the flames listed in Table 3.
- The mixture fractions provided for the 5GP cases as boundary conditions are obtained from species data collected using Raman-Rayleigh measurements at Sandia.
- File "Boundary Conditions-Pilot-CH4-3G&5G.xlsx" contains the measured conditions near the exit plane for the reacting pilots (3GP and 5GP). Also given are the flowrates and mole fractions of reactants upstream of the pilot flames holder.
Velocity Profiles:
Reacting_Velocity-3GP.zip
Species Profiles
The reader is referred here to a number of publications discussing the compositional structure of
these flames [3-4]. Three datasets of temperature and major species are presented, all collected
at Sandia National Laboratories using methane as fuel. One data set consists of five flames with a
3 gas pilot (I2013-3GP) and the other two consist of five flames with 5 gas pilots (I2013-5GP and
I2015-5GP). Two 5GP data sets consist of the same five flames, one collected in 2013 at a resolution
of 100 microns, and another collected in 2015 with a higher resolution of 20 microns and additional
cross planar OH LIF measurements. The 3GP flame species data was also collected at 100 microns without
the OH PLIF.
Points of note and references to the experimental setup for each dataset are noted in their individual
subsections. Note that despite attempts to preserve experimental conditions, minor discrepancies in
flame structures may be observed between the two 5GP datasets likely due to small differences in boundary
conditions for which partially premixed flames are sensitive. For validation of numerical models we
recommend use I2015-5GP due to improvements in coaxial symmetry, processing techniques, and additional
axial locations.
The following conditions are fixed for all cases and datasets:
- The pilots are as described in the experimental setup section. Both 3 and 5 gas pilots are stoichiometric, have a heat release rate of Hp=2.22 kW, and C/H ratio of 1/4. Adiabatic flame temperatures are 2480K and 2226K for the 3GP and 5GP respectively. The velocity ratio VA/VF=2.0 so that for methane fuel: φJ=4.76, UA/UF=0.89, MA/MF =3.6, and ξJ=0.217.
- The coflow air velocity is fixed at: UC=15m/s.
- For all cases there are some differences in results from the positive and negative sides of the burner due to asymmetry of the inner jet tube. For this reason, only the positive side data is used to calculated conditional mean and RMS profiles. The level of asymmetry changes from case to case and can be observed in the radial profiles.
I2013-3GP:
The I2013-3GP dataset provides multi-scalar measurements for five flames, three at a fixed bulk velocity, Uj=82 m/s (FJ200-3GP-Lr100-82, FJ200-3GP-Lr300-82 and FA200-3GP-Lr100-82) but with either different burner configuration or recession, and two higher velocity cases (FJ200-3GP-Lr100-115 and FJ200-3GP-Lr100-139) with the same level of inhomogeneity. The three FJ-3GP-Lr100 cases have the same inlet configuration to demonstrate the effect of increasing velocity and different departures from blow-off. More specific information about these flames can be found in Table 4.
The diagnostic system has been described in detail elsewhere [5,6] and uses combined Raman and Rayleigh scattering and laser induced fluorescence of CO to obtain temperature and major specie's mass fractions along a 6mm probe length. Groups of 500 shots were taken at radial locations 3mm apart giving at least 1000 samples for most radial locations.
| Configuration | Lr | UJ (m/s) | UA (m/s) | UF (m/s) | ReJ | Hr (kW) | UJUbo (%) | x/D |
|---|---|---|---|---|---|---|---|---|
| FA200-3GP-Lr100-82 | 100 | 82 | 192.2 | 42.7 | 39200 | 39.4 | 88 | 1, 5, 10, 12, 15, 20, 30 |
| FJ200-3GP-Lr300-82 | 300 | 82 | 85.4 | 96.1 | 39200 | 39.4 | 73 | 1, 5, 10, 12, 15, 20, 30 |
| FJ200-3GP-Lr100-82 | 100 | 82 | 85.4 | 96.1 | 39200 | 39.4 | 53 | 1, 5, 10, 12, 15, 20, 30 |
| FJ200-3GP-Lr100-115 | 100 | 115 | 119.8 | 134.8 | 55000 | 55.2 | 74 | 1, 5, 10, 12, 15, 20, 30 |
| FJ200-3GP-Lr100-139 | 100 | 139 | 144.8 | 162.9 | 66500 | 66.9 | 89 | 1, 5, 10, 12, 15, 20, 30 |
I2013-3GP_Scatter.zip
I2013-3GP_Mean_RMS.zip
I2013-5GP:
Table 5 shows the conditions for the I2013-5GP measurements presented here, all using methane as fuel. Three of the five selected flames (FA200-5GP-Lr75-45, FJ200-5GP-Lr75-80 and FJ200-5GP-Lr300-59) have a fixed departure from blow-off (70%) but different levels of inhomogeneity at the inlet as well as different jet velocities. Flames FJ200-Lr75-57, FJ200-Lr75-80, and FJ200-Lr75-103 have the same inlet configuration but increasing jet velocity and hence different departures from blow-off.
The diagnostic system is the same as used for I2013-3GP and uses combined Raman and Rayleigh scattering and laser induced fluorescence of CO to obtain temperature and major specie's mass fractions along a 6mm probe length. For a more detailed description of the laser and optical setup refer to the following [5,6].
| Configuration | Lr | UJ (m/s) | UA (m/s) | UF (m/s) | ReJ | Hr (kW) | UJUbo (%) | x/D |
|---|---|---|---|---|---|---|---|---|
| FA200-5GP-Lr75-45 | 75 | 45 | 105.8 | 23.5 | 21200 | 21.8 | 70 | 1, 2, 3, 5, 7, 10, 12, 20, 30 |
| FJ200-5GP-Lr300-59 | 300 | 59 | 61.5 | 69.2 | 27600 | 28.5 | 70 | 1, 2, 3, 5, 7, 10, 12, 20, 30 |
| FJ200-5GP-Lr75-57 | 75 | 57 | 59.5 | 67 | 26800 | 27.6 | 50 | 1, 2, 3, 5, 7, 10, 12, 20, 30 |
| FJ200-5GP-Lr75-80 | 75 | 80 | 83.4 | 93.8 | 37500 | 38.6 | 70 | 1, 2, 3, 5, 7, 10, 12, 20, 30 |
| FJ200-5GP-Lr75-103 | 75 | 103 | 107.2 | 120.6 | 48300 | 49.6 | 90 | 1, 2, 3, 5, 7, 10, 12, 20, 30 |
Note:
- Only measurements at the axial locations marked in bold in Table 5 are available in data set I2013-5GP.
- For the 5GP gases listed in Table 4, velocity field measurements are not available. However the velocity fields may be validated against the data provided for the 3GP cases listed in Table 3.
I2013-5GP_Scatter.zip
I2013-5GP_Mean_RMS.zip
I2015-5GP:
The flames presented in the I2015-5GP data set are the same as those of I2013-5GP, the details of which may be found in Table 5. The reason for this newer dataset was to allow a closer look at regions of interest in these flames and as such data was collected at three additional axial locations, x/D=2, 3 and 7 and a greater number of shots (~2000) were taken at specific radial locations. Despite best efforts to maintain flowrates between the data collection in 2013 and 2015 there are slight differences between the two datasets which are related to high sensitivity of these partially premixed to small changes in boundary conditions. Flame symmetry is also improved in 2015 dataset over the 2013 ones.
The experimental setup used for the 2015 measurements in described in more detail in the following publications [5] but a brief description will be given here. The laser diagnostic setup for the Raman/Rayleigh/COLIF portion is unchanged from the earlier measurements of these flames bar reducing the on-chip radial bin width of the Raman camera. The use of a wavelet denoising algorithm enabled the finer spatial resolution [7]. In addition to the increased resolution, planar laser induced fluorescence measurements of OH were used to provide information on the three dimensional structure of the flames.
Knowledge of the instantaneous flame orientation in combination with multi-scalar line measurements would allow calculation of full three dimensional scalar dissipation rates. However measurement of the flames normal along the full probe length is extremely difficult, so as a compromise, iso-surfaces from OH PLIF measurements are used to approximate scalar gradients. This places limitations on samples where these measurements are viable, particularly to areas with viable levels of OH signal and where the iso-contour tangent is far from the radial axis. Additionally flame fronts close to parallel with the laser axis have increased uncertainties [8,9] and so, in the files below, three dimensional scalar dissipation for samples where the angle between the iso-surface normal and the laser axis, θ>50°, are not included. The reporting of samples with unusable OH data or flame normal angles above the threshold is explained in the notes below.
Notes:
- Samples with insufficient OH signal to determine flame front angle are given a NaN value in the theta column. Those samples with angles above the threshold to give reliable three dimensional gradient corrections are given NaN in the X3d column.
- Due to issues with the burner traverse, offsets have been applied the radial values to account for drift during axial movement. A more in depth explanation and a table of the exact values used may be found in this PDF.
I2015-5GP_Scatter.zip
I2015-5GP_Mean_RMS.zip
Image Sequences for HS-LIF-OH:
Planar laser induced florescence of OH (HS-LIF-OH) was performed at a repetition rate of 10kHz. This imaging is performed at the University of Sydney using CNG as fuel. Sample images are presented here for selected flames shown in Table 6 and for selected axial locations. The full data set is huge and may be made available on request.
Each page of images shows samples for the five flames listed in Table 6 labelled (a) to (e) on the LHS of each band of images referring to the following flames (from top to bottom): (a) FA200-3GP-Lr100-82, (b) FJ200-3GP-Lr300-82, (c) FJ200-3GP-Lr100-82, d) FJ200-3GP-Lr100-115, e) FJ200-3GP-Lr100-139. Note that images in a given row are time-sequenced with a separation of 0.1ms between images (10kHz) but images in different rows corresponding to different axial locations (x/D=8 to 20) are not in time-sequences and are stacked together for convenience.
| File | Configuration | Lr | UJ (m/s) | UA (m/s) | UF (m/s) | ReJ | Hr (kW) | UJUbo (%) |
|---|---|---|---|---|---|---|---|---|
| a) | FA200-3GP-Lr100-82 | 100 | 82 | 192.2 | 42.7 | 39200 | 40.3 | 88 |
| b) | FJ200-3GP-Lr300-82 | 300 | 82 | 85.4 | 96.1 | 39200 | 40.3 | 73 |
| c) | FJ200-3GP-Lr100-82 | 100 | 82 | 85.4 | 96.1 | 39200 | 40.3 | 53 |
| d) | FJ200-3GP-Lr100-115 | 100 | 115 | 119.8 | 134.8 | 55000 | 56.5 | 75 |
| e) | FJ200-3GP-Lr100- | 100 | 139 | 114.8 | 162.9 | 66500 | 68.2 | 89 |
- Meares, S. Masri, A.R. "Turbulent Diffusion Flames of Hydrocarbon Fuels Stabilised on a Bluff Body", Combustion and Flame, 161(2), 2014, pp. 484-495
- Meares, S. "Turbulent Piloted Jet Flames with Compositionally Inhomogeneous Inlets", PhD Thesis, The University of Sydney, 2014
- Meares, S. Prasad, V.N. Magnotti, G. Barlow, R.S. Masri, A.R. "Stabilization of piloted turbulent flames with inhomogeneous inlets", Proceedings of the Combustion Institute, 35:1477-1484 (2014).
- Barlow, R.S. Meares, S. Magnotti, G. Cutcher, H. Masri, A.R. "Local Extinction and Near Field Scalar Structure in Piloted Turbulent CH4/air Flames with Inhomogeneous Inlets", Combustion and Flame, 192, 2015, pp. 3516-3540
- M.S. Sweeney, S. Hochgreb, M.J. Dunn, R.S. Barlow, "The Structure of Turbulent Stratified and Premixed Methane/Air Flames I: Non-swirling flows" Combustion and Flame, 159, (9) (2012) 2896-2911.
- R.S. Barlow, G.H. Wang, P. Anselmo-Filho, M.S. Sweeney, S. Hochgreb, "Application of Raman/Rayleigh/LIF diagnositcs in Turbulent Stratified Flames" Proceedings of the Combustion Institute, 32, (1) (2009) 945-953.
- M.S. Sweeney, S. Hochgreb, M.J. Dunn, R.S. Barlow, "Multiply Conditioned Analyses of Stratificatio0n in Highly Swirling Methane/Air Flames" Combustion and Flame, 160, (2) (2013) 322-334.
- M.S. Sweeney, S. Hochgreb, R.S. Barlow, "The Structure of Premixed and Statified Low Turbulence Flames" Combustion and Flame, 158, (5) (2011) 935-948.
- A.N. Karpetis, T.B. Settersten, R.W. Schefer, R.S. Barlow, "Laser imaging system for determination of three-dimensional scalar gradients in turbulent flames" Opt. Lett., 29, (4) (2004) 355-7.
DISCLAIMER: No responsibility is assumed by the suppliers of this data for any injury and/or property damage as a matter of products liability, negligence or otherwise, or from any use or operation of any methods, products, instructions, or ideas based on these data.