DATABASE FOR DILUTE SPRAY JETS AND FLAMES
Release 1.2 Date 19/06/2018
Release 1.1 Date 20/05/2014
Release 1.0 Date 15/04/2011
This data base is aimed to assist in improving current understanding and enhancing modelling capabilities of dilute spray jets and flames. A range of liquid fuels are studied in non-reacting and reacting turbulent with the objective with a focus on understanding the dynamics of droplets in terms of dispersion, evaporation and interaction of droplets with turbulent flows. Another objective is to explore the ignition and combustion characteristics as well as understand the burning modes of droplets. The latter issue questions whether the reactions zones are situated around single droplets or droplet clouds. The International Workshop on the Turbulent Combustion of Sprays is aimed at advancing these topics through regular interaction between modelers and experimentalists. This section provides a detailed description of a dilute spray burner that forms a benchmark for such advances and interactions. Links are provided under the following headings:
- The piloted spray burner
- Stability limits and measurements
- Non-reacting spray jets
- Spray flames of acetone
- Spray flames of ethanol
1. THE PILOTED DILUTE SPRAY BURNER:
A dimensioned schematic of the piloted dilute spray burner is shown in Fig. 1 with detailed dimensions provided in insets A and B. The burner comprises a base that contains the spray generating device leading to a flow contraction with a ratio of 10:1 and a pilot flame holder. The entire burner assembly is situated in a co-flowing stream of air. The central jet nozzle inner diameter D is 10.5 mm with a wall thickness of 0.5mm, the outer diameter of the annulus is 25.0 mm and the lip thickness is 0.2 mm. The pilot flame holder is fixed 7.0 mm upstream of the nozzle exit and has 72 holes concentrically aligned at 7.0 mm, 9.0 mm and 11 mm radius from the centre. Each row contains 24 holes with diameters 0.9 mm, 1.0 mm and 1.1 mm respectively. A co-flow with a diameter of 104 mm surrounds the burner and the co-flow/burner assembly is mounted in a vertical wind tunnel. The tunnel exit has a cross section of 290 x 290 mm. The exit plane of the co-flow and nozzle are located 59.0 mm downstream of the exit plane of the wind tunnel.
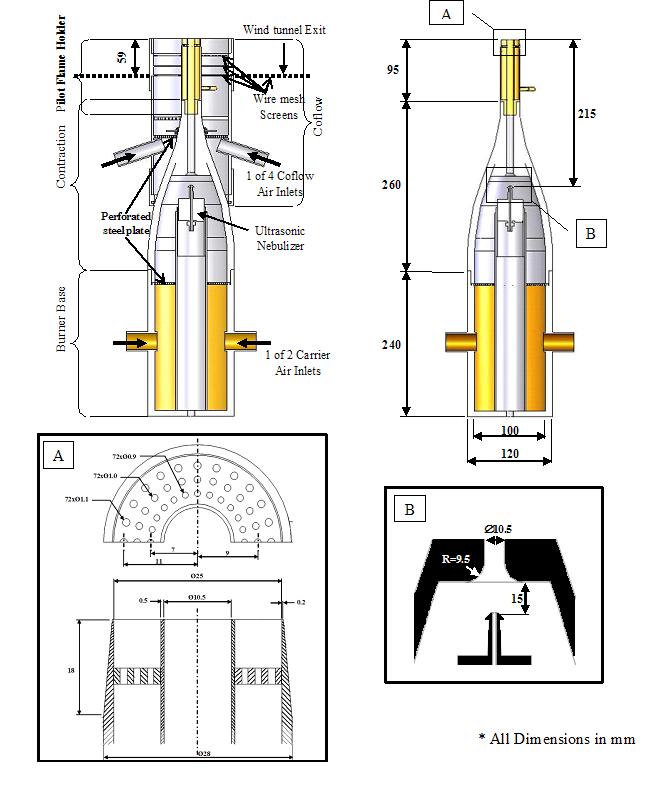
Figure 1: Burner and Coflow Assembly
The spray is generated using a Sono-Tek ultrasonic nebulizer model number 8700-48. A broadband ultrasonic generator is used to deliver a high frequency electrical energy required to operate the nebulizer which is centered inside the burner using four sets of screws. The nebulizer head is located 215 mm upstream of the jet exit plane. Droplets of liquid fuel are generated on the nebulizer's surface, initially with zero momentum, and convected downstream to the burner's exit plane with a carrier stream of air (unless stated otherwise). The separation between the nebulizer head and the pipe inlet, as well as the shape of the pipe's inlet (details of which are shown in the inset of Fig. 1), are important to the formation of a uniform spray profile at the pipe's exit plane. Further details about the burner may be found in the references mentioned below..
2. STABILITY LIMITS AND MEASUREMENTS
The key controlling parameters for flames of a given fuel and carrier are the bulk jet velocity of the gas carrier, Uj (m/s) and the mass loading of droplets (g/min). Acetone and ethanol fuels are used throughout and these have atmospheric boiling points of 58°C and 72°C respectively. For all the reacting cases, the pilot jet stream is maintained at stoichiometric, feeding a mixture of acetylene, hydrogen and air that has the same C/H ratio as the main fuel which is 2 for acetone and 3 for ethanol. The bulk velocity for the non-reacting mixture in the pilot stream is maintained at 1.5m/s. The stability limits for acetone and ethanol fuels are shown in Fig. 2. Also shown on Fig. 2 are the cases selected for which data are tabulated here.
Three series, with eight cases in each series are selected for further study and relevant properties for each of these cases are summarized in Tables 1-3. One series is for non-reacting jets of acetone and kerosene is shown in Table 1a and 1b, respectively. Kerosene, with a boiling point of ~200°C (range is from 150°C to 300°C) is used here as an almost non-evaporating liquid to test the dispersion of droplets (with little or no evaporation). Only two cases of non-reacting kerosene are studied, namely KS6 and KS7.
The remaining two series, shown in Tables 2 and 3 are for acetone and ethanol flames, respectively. Within each series, sequences of cases may be chosen to study the effects of increasing the carrier velocity at a fixed liquid flow rate (such as sequence 1, 2, 5 and 7) or the effects of increasing the liquid fuel flow rate for a fixed carrier velocity (such as sequence 4, 3, and 1). To facilitate comparison, cases having the same numerical reference (such as SP1, AcF1 and EtF1) have similar mass flow rates for both carrier gas and liquid fuel. Three liquid fuel mass flow rates are used, namely 23.4, 45 and 75 g/min and these are referred as “Low”, “Mid” and “High” respectively. Also, four carrier velocities of 24, 36, 48 and 60 m/s (corresponding respectively to carrier mass flow rates of 150, 225, 301 and 376 g/min) are employed as shown in Tables 1-3. It should be noted that air has been used as carrier for all the cases studied here.
The following measurements were performed:
- Single-point, mean and rms velocity fluctuations using Laser Doppler Velocimetry (LDV)
- Droplet fluxes and size distribution using Phase Doppler Anemometry (PDA)
- Planar imaging of selected scalar such OH, acetone or formaldehyde (reacting cases only)
Two sets of LDV/PDA measurements were taken for the velocity and droplet fields of each of the selected cases shown in Tables 1-3 and are referred to herein as "Experiment A" and "Experiment B". Experiment B was conducted later in order to measure the radial velocity component which was not available from Experiment A. Measurements in the Kerosene cases (KS6 and KS7) were done only once in conjunction with Experiment B. The relevant boundary conditions measured for experiments A and B are reported in Tables 1-3 and both sets of data will be made available on the web. There are differences between both sets of measurements, albeit small and these highlight the difficulty and the degree of repeatability associated with these experiments. While it is recommended that Experimental Set B be used since it is more complete, users have access to both sets of data make their own judgments in this regard.
With reference to the quantities listed in Tables 1-3, the liquid fuel volume flow rates reported for the jet exit plane were obtained from phase Doppler particle anemometry measurements. The temperature is measured at the jet centerline using thermocouples. The overall equivalence ratios ϕoverall of acetone and ethanol flames are calculated using the total mass flow rate of carrier air and the injected mass flow rate of the liquid fuel assuming that it is totally evaporated. The equivalence ratio at the jet exit plane ϕexit, is calculated using the mass flow rate of fuel vapor measured at the exit plane and the total carrier air flow rate. Further description of the experimental set-up and the associated calibration and data processing may be found in the references mentioned below.
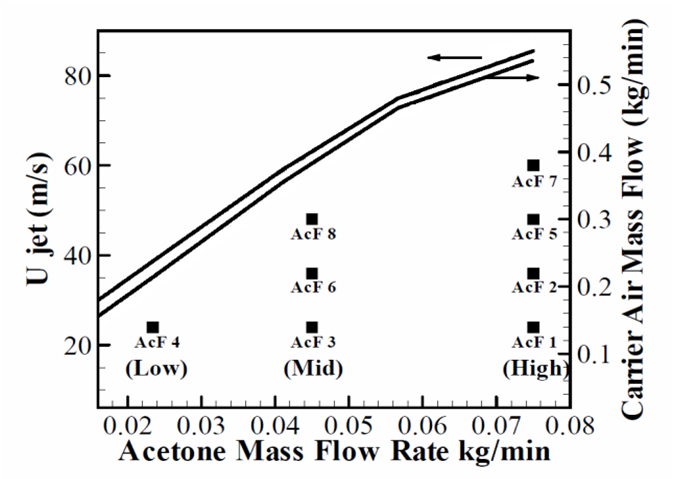
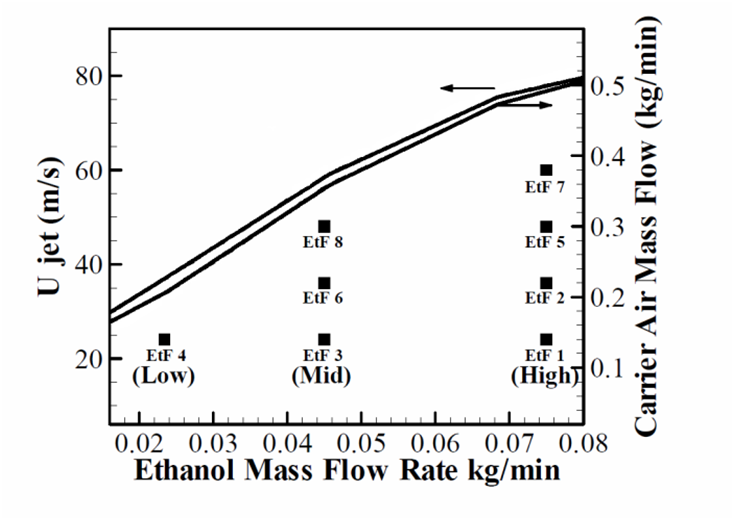
Figure 2: Blow-off limits for the acetone and ethanol flames. Cases 1 to 8 selected for further study are also shown.
Note: While agreement between Experiments A and B is generally very good for the measured velocities, Tables 1-3 show clear discrepancies with respect to the liquid flow-rates measured at the jet exit plane. This is due to the notorious difficulty in measuring volume flux accurately. For some cases the agreement is excellent while for others it is relatively poor. The extent of the disagreement is random in that a non-reacting case may show close results between Experiments A and B while its reacting counterpart may show significant differences. The overall percentage difference between Experiments A and B in the measured liquid flow-rate at the jet exit plane is: (i) 13.7% for non-reacting acetone, (ii) 24.8% for reacting acetone, and (iii) 12.2% for reacting ethanol. To set the boundary conditions for the volume flux, we recommend that an average be taken from experiments A and B but we leave the decision to the discretion of the reader.
3. NON-REACTING SPRAY JETS
Selected Cases:
Table 1a and 1b shows the relevant properties of the non-reacting selected cases. In Table 1a, eight selected cases for non-reacting acetone are shown while Table 1b shows only two non-reacting cases for Kerosene (Experimental Set B only). Kerosene has a much higher boiling point than acetone and hence may be treated as almost non-evaporating at ambient conditions. Measurements in the Kerosene jets provide useful information about droplet dispersion and may highlight the impact of evaporation when compared with similar measurements in acetone jets.
Note that both Experimental Sets A and B are provided where available. Experimental set B is recommended since it is more complete and contains measurements of radial velocities which are not in Experimental Set A.
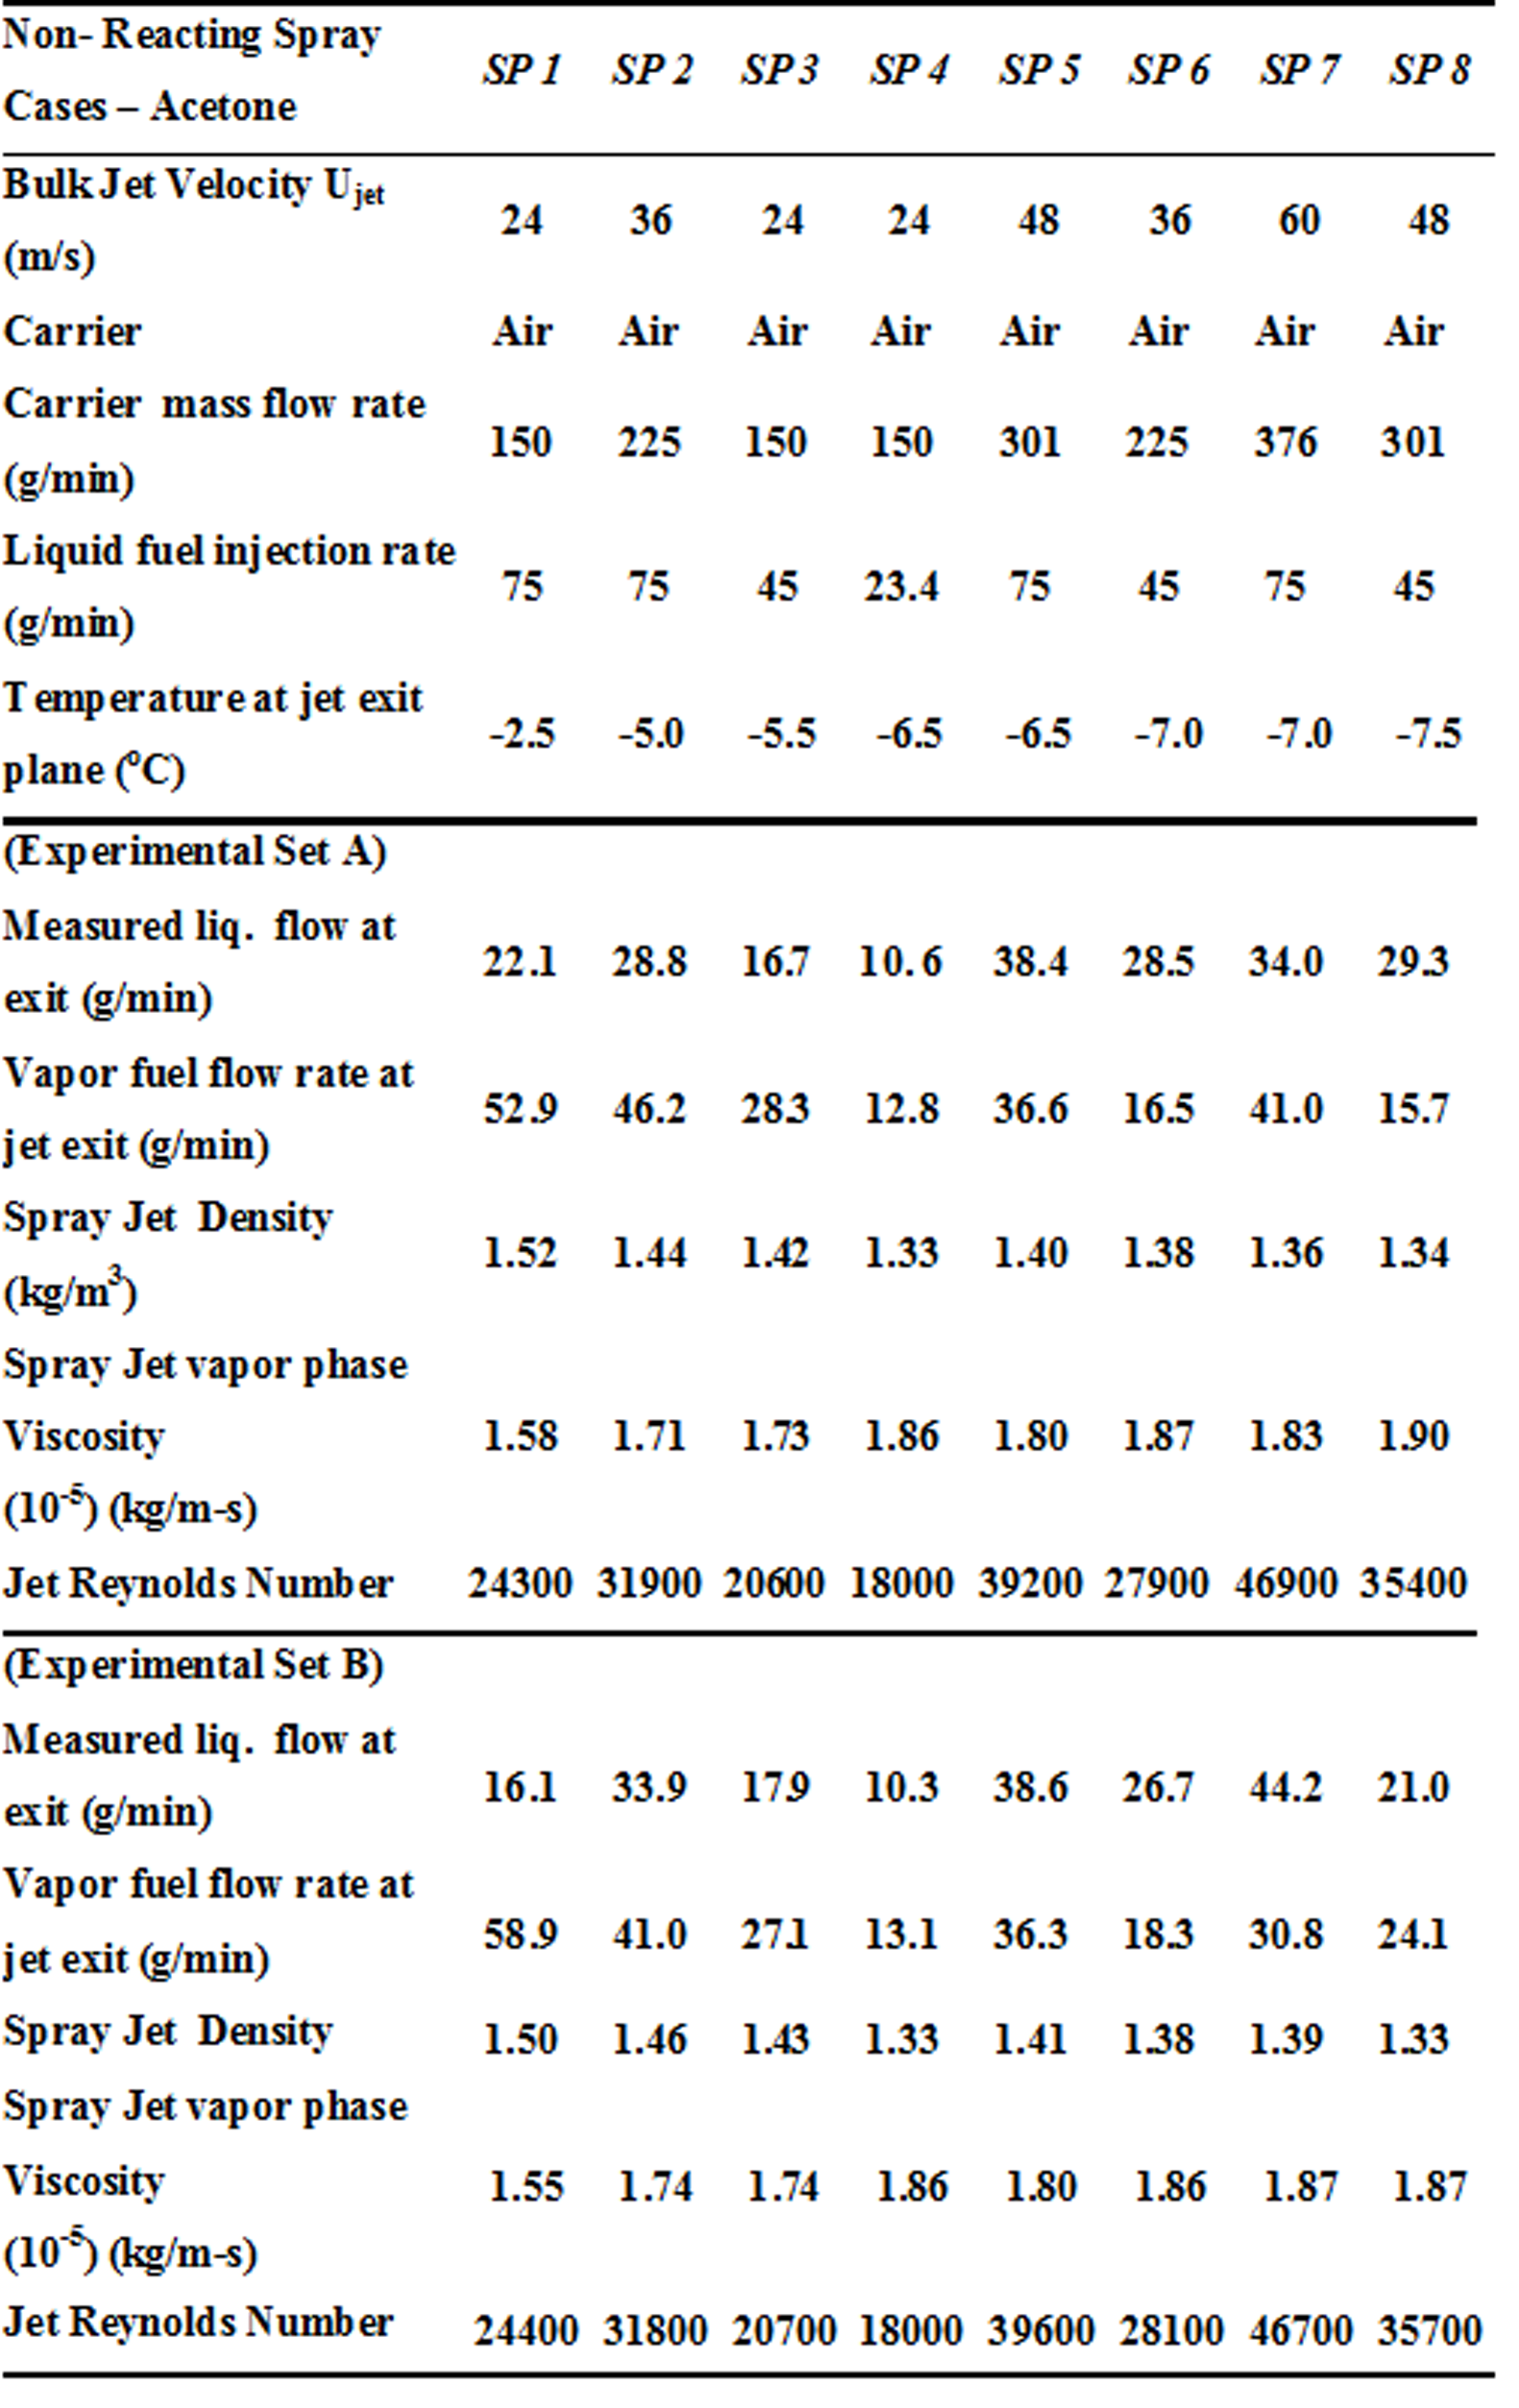
Table 1a: Selected non-reacting cases
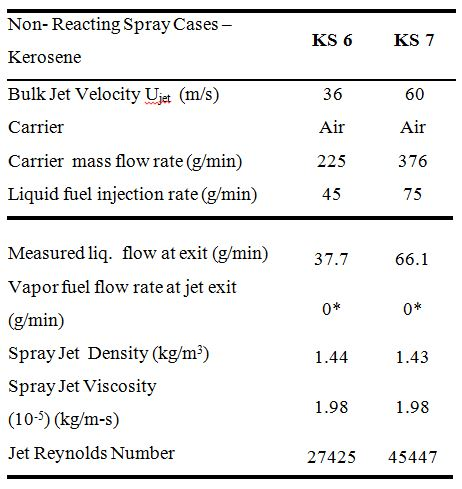
Table 1b. Non-reacting cases for Kerosene (Experimental Set B only)
*difference in measured and expected liquid mass flow-rate is strongly attributed to inherent inaccuracy of volume flux measurements, which can be of the order of 15% (see Gounder et al., Comb. Flame 2012).
All the cases tabulated here use the following boundary conditions:
Wind Tunnel Air Velocity = 4.5m/s
Coflow Bulk Velocity = 4.5m/s
Bulk Velocity in pilot stream (air only) = 4.5m/s
Further details of the boundary conditions may be obtained from the information in the Tables 1-3. For boundary conditions relating to the droplet velocities and fluxes see individual data files for the radial location closest to the jet exit plane (x/D-0.3). The boundary conditions for the gas phase in the jet as well as the coflow are described here:
In the central fuel jet, measurements of the gas phase are taken as those corresponding to the droplets smaller than 10 microns. In the pilot stream, velocities are estimated from the bulk flow and the equilibrium temperature. In the coflow, actual LDV measurements are taken by seeding the flow with sub-micron solid particles. Radial profiles of mean velocity and turbulence are given for three selected cases, namely 2, 6, and 7 and these can be downloaded from here:
Gas phase Velocity profiles at Jet exit (.zip 344kB)
Note: In the tabulated velocity data, channel 1 refers to the axial velocity component and channel 2 refers to the radial velocity component.
Tabulated Spray Data
The following links provide extensive data for each of the cases shown in Table 1 along with the Kerosene cases.
Non Reacting Spray Jets Data File (.zip)
Non Evaporating Kerosene Spray Jets Data File (.zip)
Each CASE directory contains a number of sub-directories that correspond to the axial locations at which measurements were made. In each subdirectory, the following information resides in separate files:
a. Droplet distribution: droplet size distribution (in counts) measured at various radial locations at the given axial location. Note that the axial location closest to the jet exit plane (x/D=0.3) may be taken as boundary condition for the droplet velocities and rms fluctuations (conditioned on droplet size), as well as droplet distribution.
b. Droplet flux: conditioned with respect to a range of droplet bin sizes, this file provide a measure of the droplet flux in cm3/cm2/s.
c. Droplet velocities: this data file gives the mean axial and radial velocities as well as rms fluctuations and shear stresses (where available) for various radial location at the given axial location. These data are also given conditioned with respect to a range of droplet size bins.
4. SPRAY FLAMES OF ACETONE
Selected Cases:
Table 2 shows the relevant properties of the reacting Acetone selected cases. Note that both Experimental Sets A and B are provided where available. Experimental set B is recommended since it is more complete and contains measurements of radial velocities which are not in Experimental Set A.
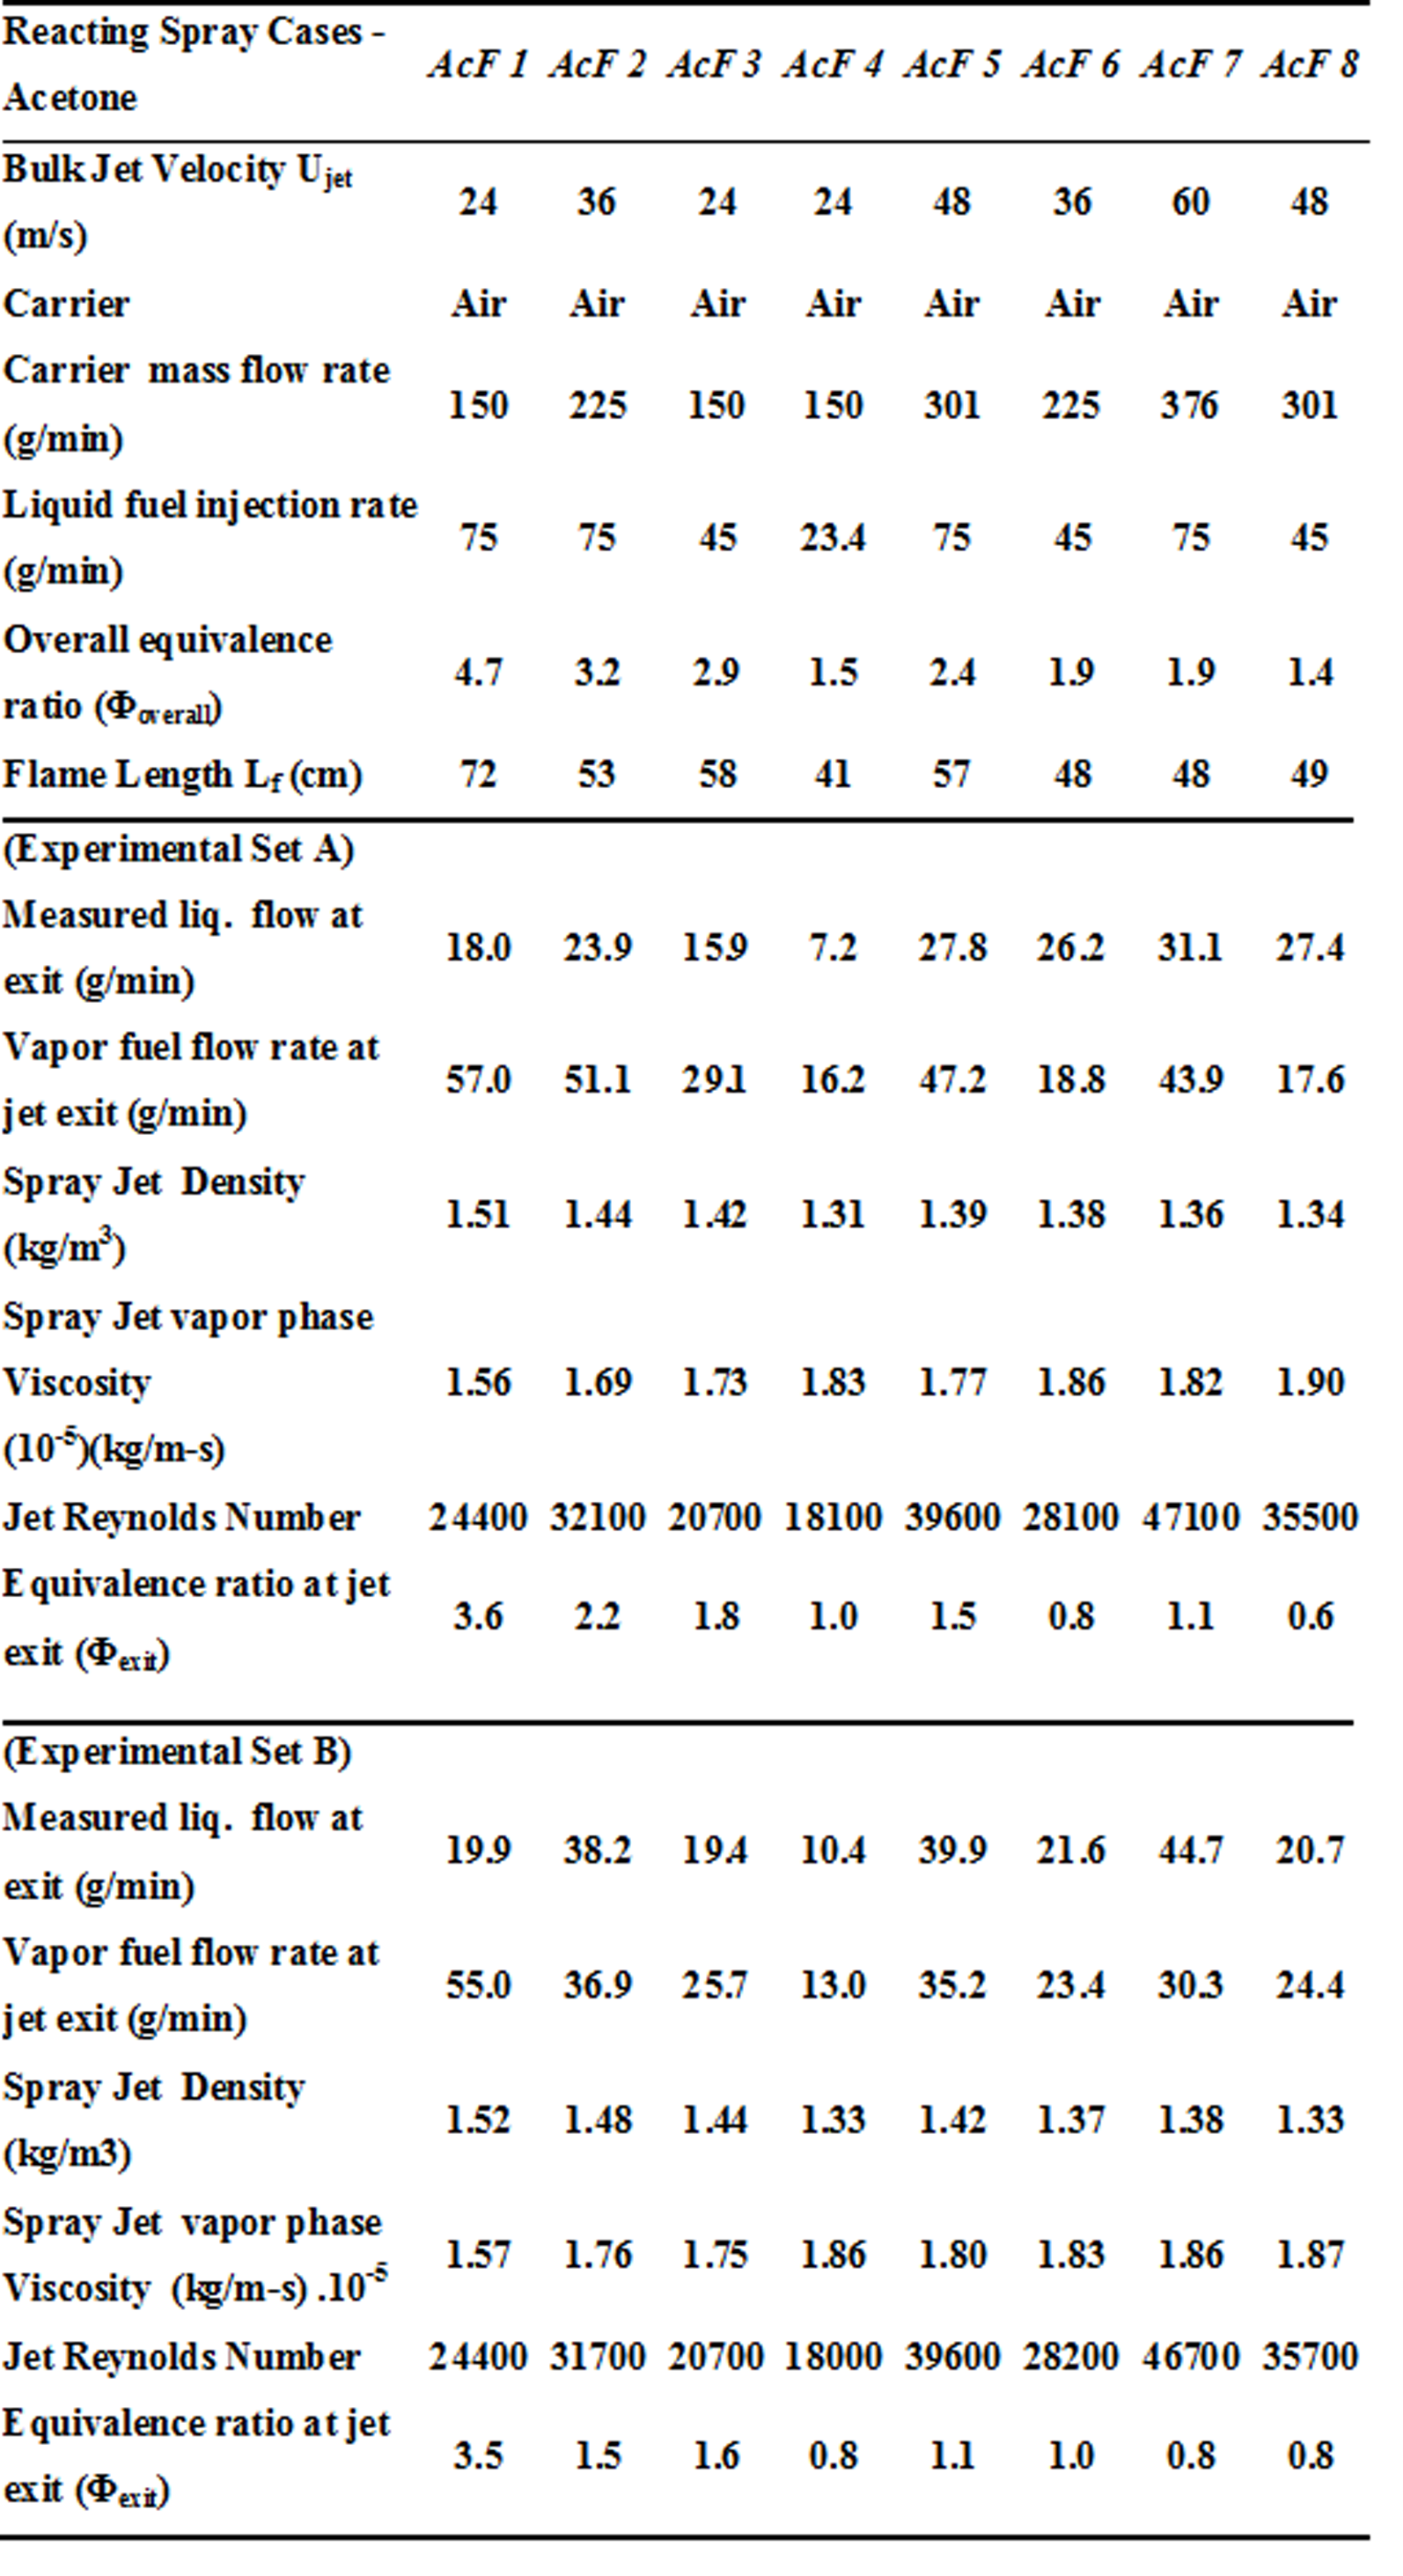
Table 2: Selected Reacting Acetone cases
All the cases tabulated here use the following boundary conditions:
Wind Tunnel Air Velocity = 4.5m/s
Coflow Bulk Velocity = 4.5m/s
Pilot mixture Bulk Velocity = 1.5m/s
Further details of the boundary conditions may be obtained from the information in the Tables 1-3. For boundary conditions relating to the droplet velocities and fluxes see individual data files for the radial location closest to the jet exit plane (x/D-0.3). The boundary conditions for the gas phase in the jet as well as the coflow are described here:
In the central fuel jet, measurements of the gas phase are taken as those corresponding to the droplets smaller than 10microns. In the pilot stream, velocities are estimated from the bulk flow and the equilibrium temperature. In the coflow, actual LDV measurements are taken by seeding the flow with sub-micron solid particles. Radial profiles of mean velocity and turbulence are given for three selected cases, namely 2, 6, and 7 and these can be downloaded from here:
Gas phase Velocity profiles at Jet exit (.zip 344kB)
Note: In the tabulated velocity data, channel 1 refers to the axial velocity component and channel 2 refers to the radial velocity component.
Tabulated Spray Data
The following link provides extensive data for each of the cases shown in Table 2.
Reacting Acetone Spray Flames Data File (.zip)
Each CASE directory contains a number of sub-directories that correspond to the axial locations at which measurements were made. In each subdirectory, the following information resides in separate files:
a. Droplet distribution: droplet size distribution (in counts) measured at various radial locations at the given axial location. Note that the axial location closest to the jet exit plane (x/D=0.3) may be taken as boundary condition for the droplet velocities and rms fluctuations (conditioned on droplet size), as well as droplet distribution.
b. Droplet flux: conditioned with respect to a range of droplet bin sizes, this file provide a measure of the droplet flux in cm3/cm2/s.
c. Droplet velocities: this data file gives the mean axial and radial velocities as well as rms fluctuations and shear stresses (where available) for various radial location at the given axial location. These data are also given conditioned with respect to a range of droplet size bins.
Imaging
Images from the simultaneous Mie scattering and OH-LIF experiment for the Reacting Acetone Spray Flames can be downloaded from here:
LIF images of Reacting Acetone Spray Flames (.zip)
5. SPRAY FLAMES OF ETHANOL
Selected Cases:
Table 3 shows the relevant properties of the reacting Ethanol selected cases. Note that both Experimental Sets A and B are provided where available. Experimental set B is recommended since it is more complete and contains measurements of radial velocities which are not in Experimental Set A
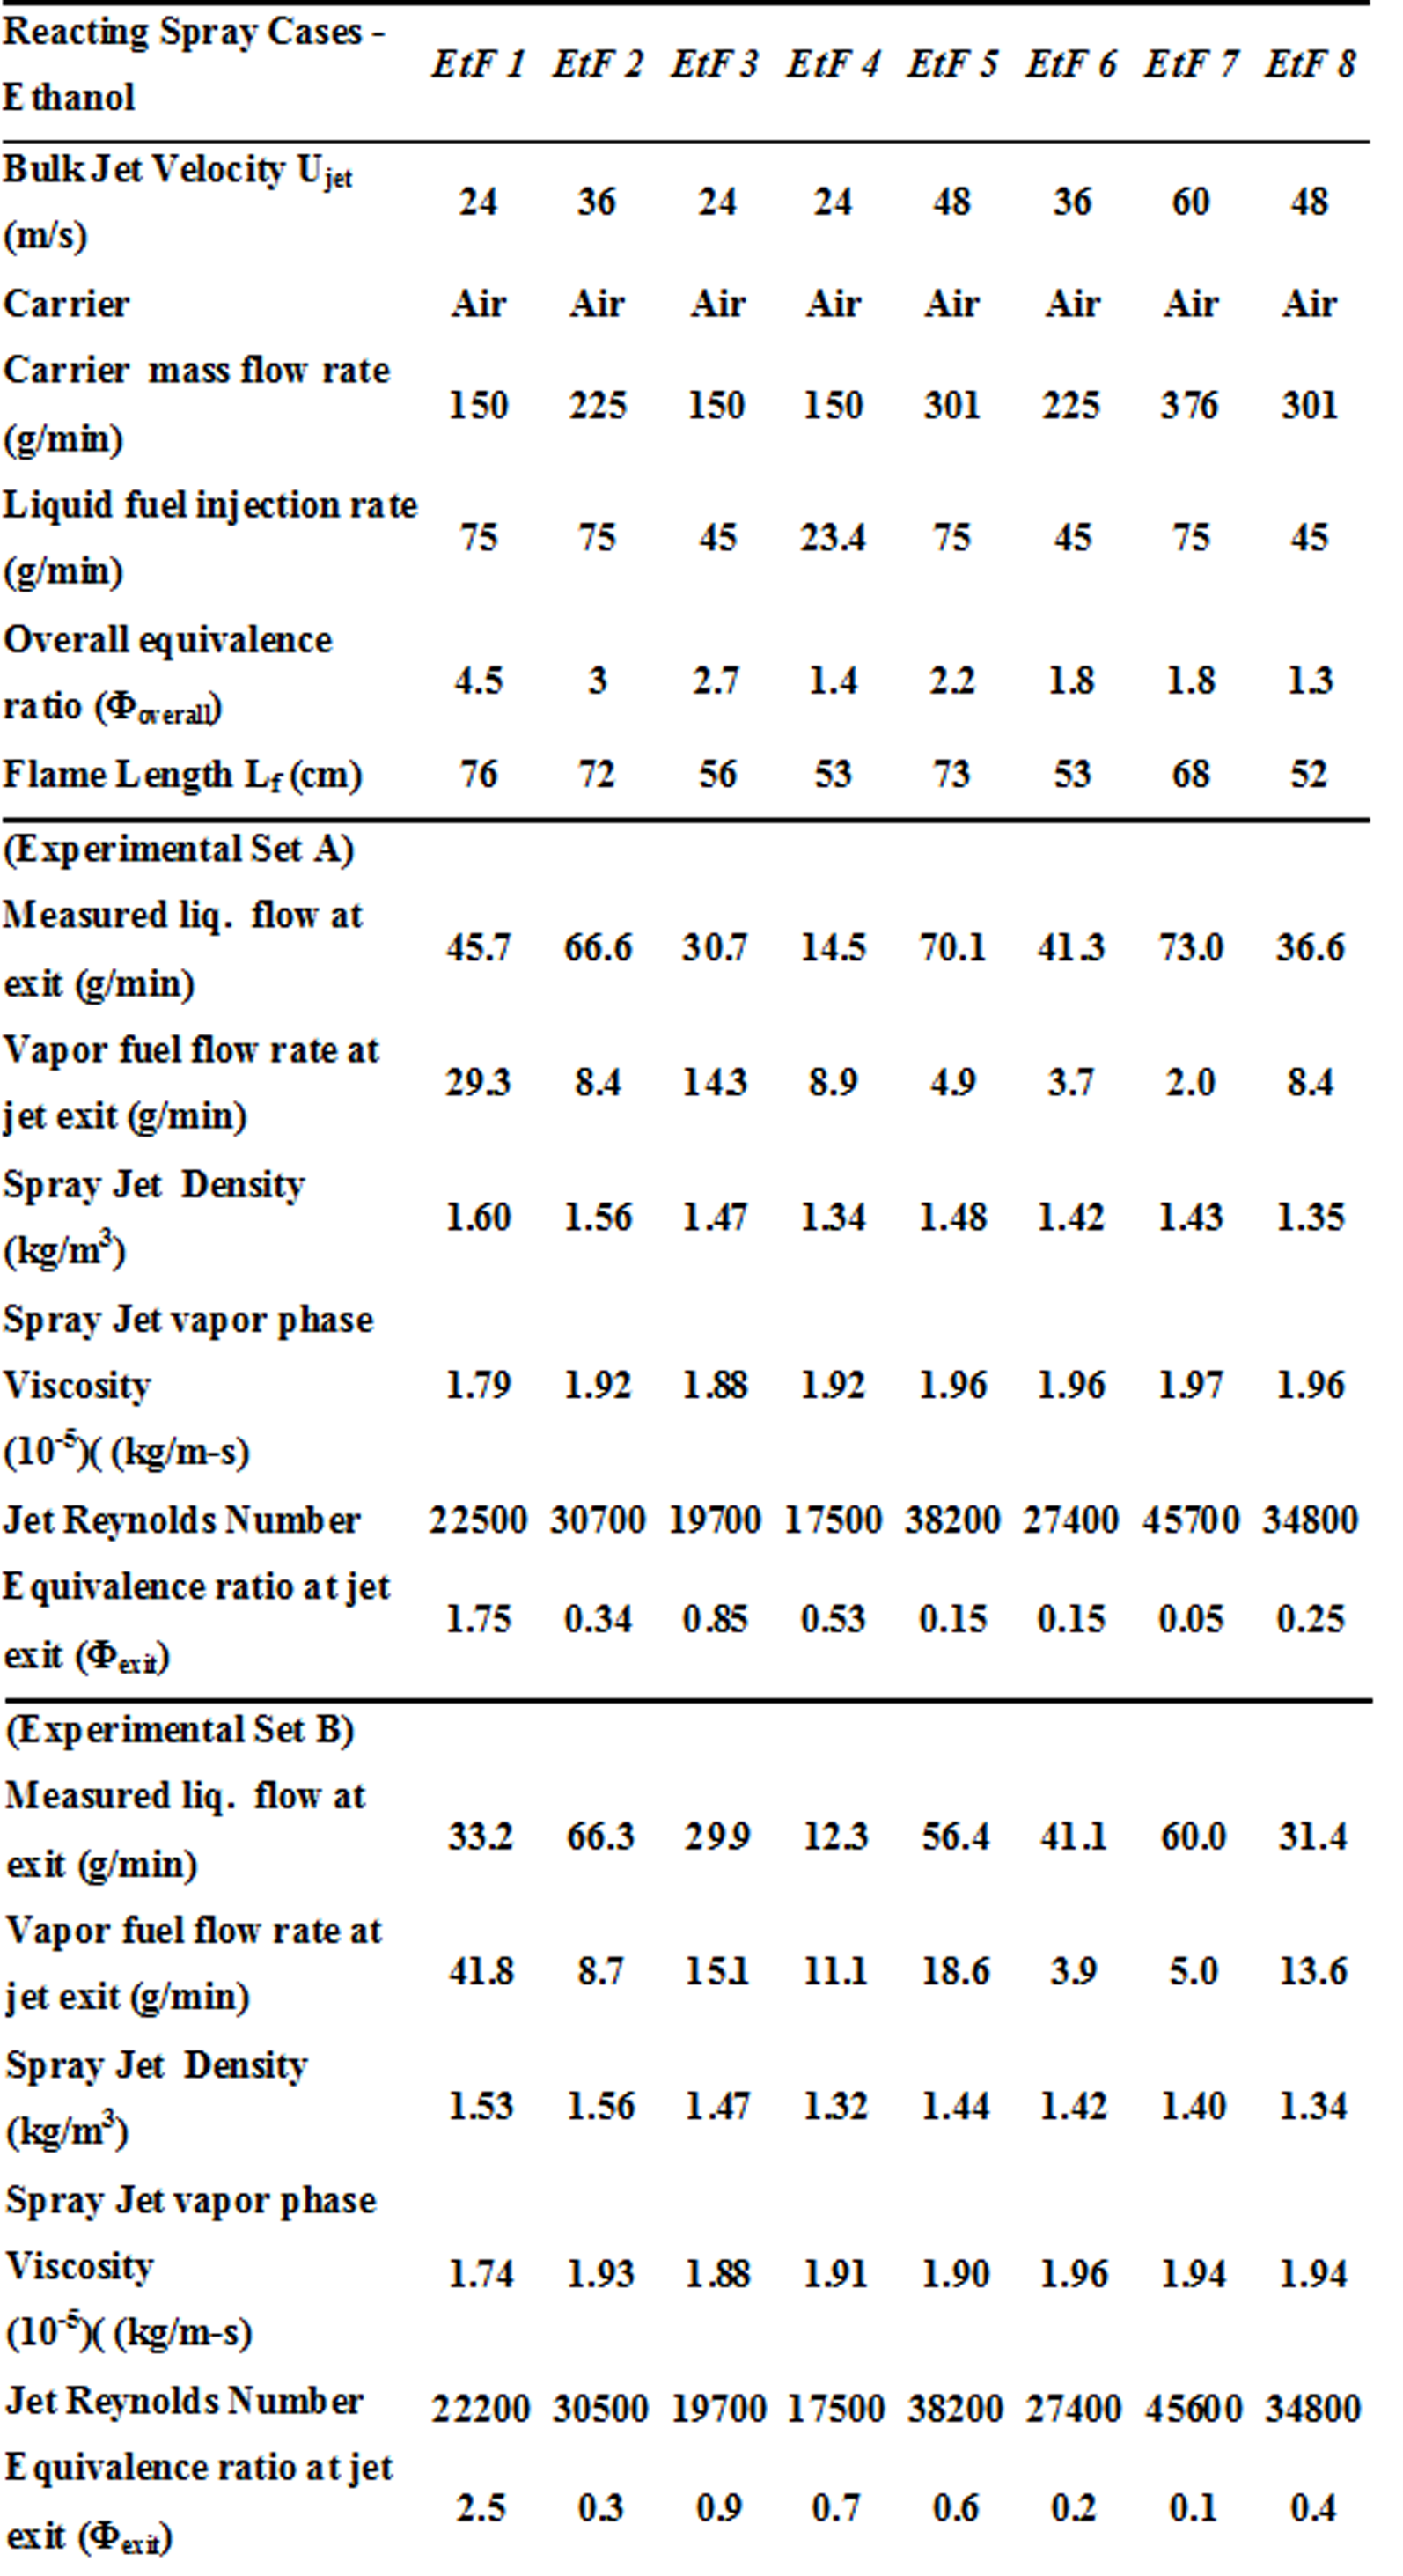
Table 3: Selected Reacting Ethanol cases
All the cases tabulated here use the following boundary conditions:
Wind Tunnel Air Velocity = 4.5m/s
Coflow Bulk Velocity = 4.5m/s
Pilot mixture Bulk Velocity = 1.5m/s
Further details of the boundary conditions may be obtained from the information in the Tables 1-3. For boundary conditions relating to the droplet velocities and fluxes see individual data files for the radial location closest to the jet exit plane (x/D-0.3). The boundary conditions for the gas phase in the jet as well as the coflow are described here:
In the central fuel jet, measurements of the gas phase are taken as those corresponding to the droplets smaller than 10microns. In the pilot stream, velocities are estimated from the bulk flow and the equilibrium temperature. In the coflow, actual LDV measurements are taken by seeding the flow with sub-micron solid particles. Radial profiles of mean velocity and turbulence are given for three selected cases, namely 2, 6, and 7 and these can be downloaded from here:
Note: In the tabulated velocity data, channel 1 refers to the axial velocity component and channel 2 refers to the radial velocity component.
Tabulated Spray Data
The following link provides extensive data for each of the cases shown in Table 3.
Reacting Ethanol Spray Flames Data File (.zip 940kB)
Each CASE directory contains a number of sub-directories that correspond to the axial locations at which measurements were made. In each subdirectory, the following information resides in separate files:
a. Droplet distribution: droplet size distribution (in counts) measured at various radial locations at the given axial location. Note that the axial location closest to the jet exit plane (x/D=0.3) may be taken as boundary condition for the droplet velocities and rms fluctuations (conditioned on droplet size), as well as droplet distribution.
b. Droplet flux: conditioned with respect to a range of droplet bin sizes, this file provide a measure of the droplet flux in cm3/cm2/s.
c. Droplet velocities: this data file gives the mean axial and radial velocities as well as rms fluctuations and shear stresses (where available) for various radial location at the given axial location. These data are also given conditioned with respect to a range of droplet size bins.
Images
Images from the simultaneous mie scattering and OH-LIF experiment for the Reacting Ethanol Spray Flames can be downloaded from here:
LIF images of Reacting Ethanol Spray Flames (.zip)
REFERENCES:
[1] Gounder, J.D., Kourmatzis, A., and Masri, A.R. Turbulent Piloted Dilute Spray Flames: Flow Fields and Droplet Dynamics, Combust. Flame 159:3372-3397 (2012)
[2] Kourmatzis, A., O'Loughlin, W., and Masri, A.R., 'Effects of Turbulence, Evaporation and Heat Release on the Dispersion of Droplets in Dilute Spray Jets and Flames', Flow. Turb. Comb. 91:405-427 (2013)..
[3] Starner, S.H., Gounder, J., and Masri, A.R., 'Effects of Turbulence and Carrier Fluid on Simple, Turbulent Spray Jet Flames', Combust. Flame 143:420-432 (2005)..
[4] Masri, A.R., and Gounder, J.D., 'Turbulent Spray Flames of Acetone and Ethanol Approaching Extinction', Combust. Sci. Technol. 182:702-715 (2010) (doi:10.1080/00102200903467754)..
[5] Masri, A.R., and Gounder, J.D., "Details and Complexities of Boundary Conditions in Turbulent Piloted Dilute Spray Jets and Flames", in "Experiments and Numerical Simulations of Diluted Spray Turbulent Combustion", Edited by Bart Merci, Dirk Roekaerts and Amsini Sadiki, ERCOFTAC Bookseries, Springer Publishers, Chapter 2, pp. 41-68, 2011..
[6] 6. Starner, S.H., Gounder, J., and Masri, A.R., ‘Effects of Turbulence and Carrier Fluid on Simple, Turbulent Spray Jet Flames’, Combust. Flame 143:420-432 (2005).
Other Resources
Reseach Facilities
- Clean Combustion Laboratory
- Energy and Environment
- Thermodynamics and Fluids
- University of Sydney Library
Postgraduate Research Opportunities
Contact Info
AMME General Office
Building J07, Level 4, S452
Darlington Campus
Phone and email
Aerospace, Mechanical and Mechatronic Engineering
Local: (02) 9351 2341 | Fax (02) 9351 7060
International: + (612) 9351 2341
Australian Center for Field Robotics
Local: (02) 9351 7126 | Fax (02) 9351 7474
International: + (612) 9351 7126
Email: [email protected]
General Office Opening Hours
The School of Aerospace, Mechanical and Mechatronic Engineering reception is open Monday to Friday from 9am-5pm (excluding public holidays).